
The Raspberry Pi Pico is an excellent embedded platform, noted for its excellent documentation (and also the RP2040 microcontroller, one of the few that is currently not made from unobtainium). But one of the great features of this board is how it gets more and more support over time. And that’s why we used it as the basis for the CANPico.
The CANPico currently has a MicroPython SDK for easily handling CAN frames, but many people have asked about a C SDK for it. So we have been working on it, and the release is imminent. But in the meantime I thought it would be useful to give a short guide on getting a debugger to work for C applications on the Pico (and CANPico).
It’s actually pretty straightforward. The best guide I found to this is in two parts:
- Part 1 covers setting up Microsoft Visual Studio Code (‘VSCode’) to develop C code for the Pico.
- Part 2 covers setting up a second Pico as an OpenOCD debugger for the Pico.
There are some issues that might be encountered when following this guide. I’m developing on an Ubuntu 20.04 VM under Parallels running on a Macbook M1. This means the 64-bit Arm version of Ubuntu is being used, and there are some problems I encountered.
The first problem is that the Arm cross-compiler that comes with Ubuntu is quite old, and a new version
has to be downloaded as a binary from Arm. This means using the 64-bit Arm Ubuntu download from
Arm’s web site. Installing this is a bit tricky because quite a few tools have embedded the
pathname /usr/bin/arm-none-eabi-gcc for the compiler. So you need to create a symbolic link
for every arm-none-eabi- tool to where the binary Arm compiler is normally installed
(the latest version installs to /usr/share/gcc-arm-11.2-2022.02-aarch64-arm-none-eabi/bin/).
I did this with:
1
sudo for i in addr2line ar as c++ c++filt cpp elfedit gcc-11.2.1 gcc-ar gcc-nm gcov gcov-dump gcov-tool gdb-add-index gfortran gprof ld ld.bfd lto-dump nm objdump ranlib readelf strings strip; do sudo ln -s /usr/share/gcc-arm-11.2-2022.02-aarch64-arm-none-eabi/bin/arm-none-eabi-$i /usr/bin/arm-none-eabi-$i; done
The next problem is the debugger. VSCode uses the Gnu debugger GDB as a backend, and the binary
file arm-none-eabi-gdb from Arm uses some dynamically linked libraries that aren’t installed by
default. You can check the libraries needed, and whether they are there with:
1
2
3
4
5
6
7
8
9
10
11
12
13
14
15
$ ldd /usr/share/gcc-arm-11.2-2022.02-aarch64-arm-none-eabi/bin/arm-none-eabi-gdb
linux-vdso.so.1 (0x0000ffffa93e5000)
libncurses.so.5 => /lib/aarch64-linux-gnu/libncurses.so.5 (0x0000ffffa8afd000)
libtinfo.so.5 => /lib/aarch64-linux-gnu/libtinfo.so.5 (0x0000ffffa8abf000)
libdl.so.2 => /lib/aarch64-linux-gnu/libdl.so.2 (0x0000ffffa8aab000)
libpython3.6m.so.1.0 => /lib/aarch64-linux-gnu/libpython3.6m.so.1.0 (0x0000ffffa8551000)
libpthread.so.0 => /lib/aarch64-linux-gnu/libpthread.so.0 (0x0000ffffa8520000)
libm.so.6 => /lib/aarch64-linux-gnu/libm.so.6 (0x0000ffffa8475000)
libexpat.so.1 => /lib/aarch64-linux-gnu/libexpat.so.1 (0x0000ffffa843e000)
libstdc++.so.6 => /lib/aarch64-linux-gnu/libstdc++.so.6 (0x0000ffffa8259000)
libgcc_s.so.1 => /lib/aarch64-linux-gnu/libgcc_s.so.1 (0x0000ffffa8235000)
libc.so.6 => /lib/aarch64-linux-gnu/libc.so.6 (0x0000ffffa80c2000)
/lib/ld-linux-aarch64.so.1 (0x0000ffffa93b5000)
libz.so.1 => /lib/aarch64-linux-gnu/libz.so.1 (0x0000ffffa8098000)
libutil.so.1 => /lib/aarch64-linux-gnu/libutil.so.1 (0x0000ffffa8084000)
I found that the libcurses library needed to be installed:
1
$ sudo apt-get install libncurses5
And the Python library I had was a different version. The workaround I found was to link to another version of the library:
1
2
$ cd /lib/aarch64-Linux-gnu
$ sudo ln -s libpython3.8.so.1.0 libpython3.6m.so.1.0
Next problem: when trying to run the debugger it won’t talk to the Pico running picoprobe, and in VSCode the console output shows a USB error. This is down to the udev rules that don’t allow
access to the Pico over USB. The fix is to use a rules file in the openocd distribution (my OpenOCD repository is cloned from the Raspberry Pi OpenOCD repo to ~github/openocd):
1
2
3
$ cd ~/github/openocd/contrib
$ sudo cp 60-openocd.rules /etc/udev/rules.d
$ sudo udevadm control --reload-rules
Next problem: the recommended Cortex extension in VSCode complains about runToMain being
deprecated. To get rid of this error, edit the launch.json and replace the line:
1
"runToMain": true,
with:
1
"runToEntryPoint": "main"
Next problem is that setting more than four breakpoints causes GDB to fail with an “Exception has occurred” error. And because breakpoints persist across sessions, it will continue to report an error after a restart. The clue is in the console where it reports:
1
2
Error: Can not find free FPB Comparator!
Error: can't add breakpoint: resource not available!
This is an easy bear trap to fall into. Be careful with those breakpoints!
Next problem is the debugging toolbar in VSCode. The debug start is the one in the floating toolbar with green ‘play’ and red ‘stop’ icons. The default debug toolbar entry in VSCode doesn’t work and fails with an error. Another bear trap!
Next problem is getting printf() on the target Pico working. The way it works is that
outputs from the UART goes to the picoprobe, which forwards it over USB serial. When you plug in
the picoprobe, the device /dev/ttyACM0 should appear (or something else if there are other USB
serial devices that grabbed the port). Annoyingly, a lot of the regular terminal tools don’t appear
to work nicely. The tool I got working to display the results is minicom. It’s installed with:
1
$ sudo apt-get install minicom
And run with:
1
$ minicom -b115200 -o -D /dev/ttyACM0
Quitting minicom is almost as hard as quitting vi: do CTRL-A then x. You do need to specify the baud rate, even though it’s coming over USB serial.
The final problem is that sometimes the errors aren’t just finicky whining from a fragile toolchain, but actually are genuine. I spent a couple of minutes trying to find out why the debugger had stopped working only to discover I’d unplugged the picoprobe!
Finally, here’s a picture of a CANPico board connected to a Pico running the picoprobe firmware. Individual header pins are soldered into the Pico mounted on the CANPico board (for power/ground, UART and SWD). The colours of the wires match the ones in the official guide, and note that RX/TX for the UART are swapped over.
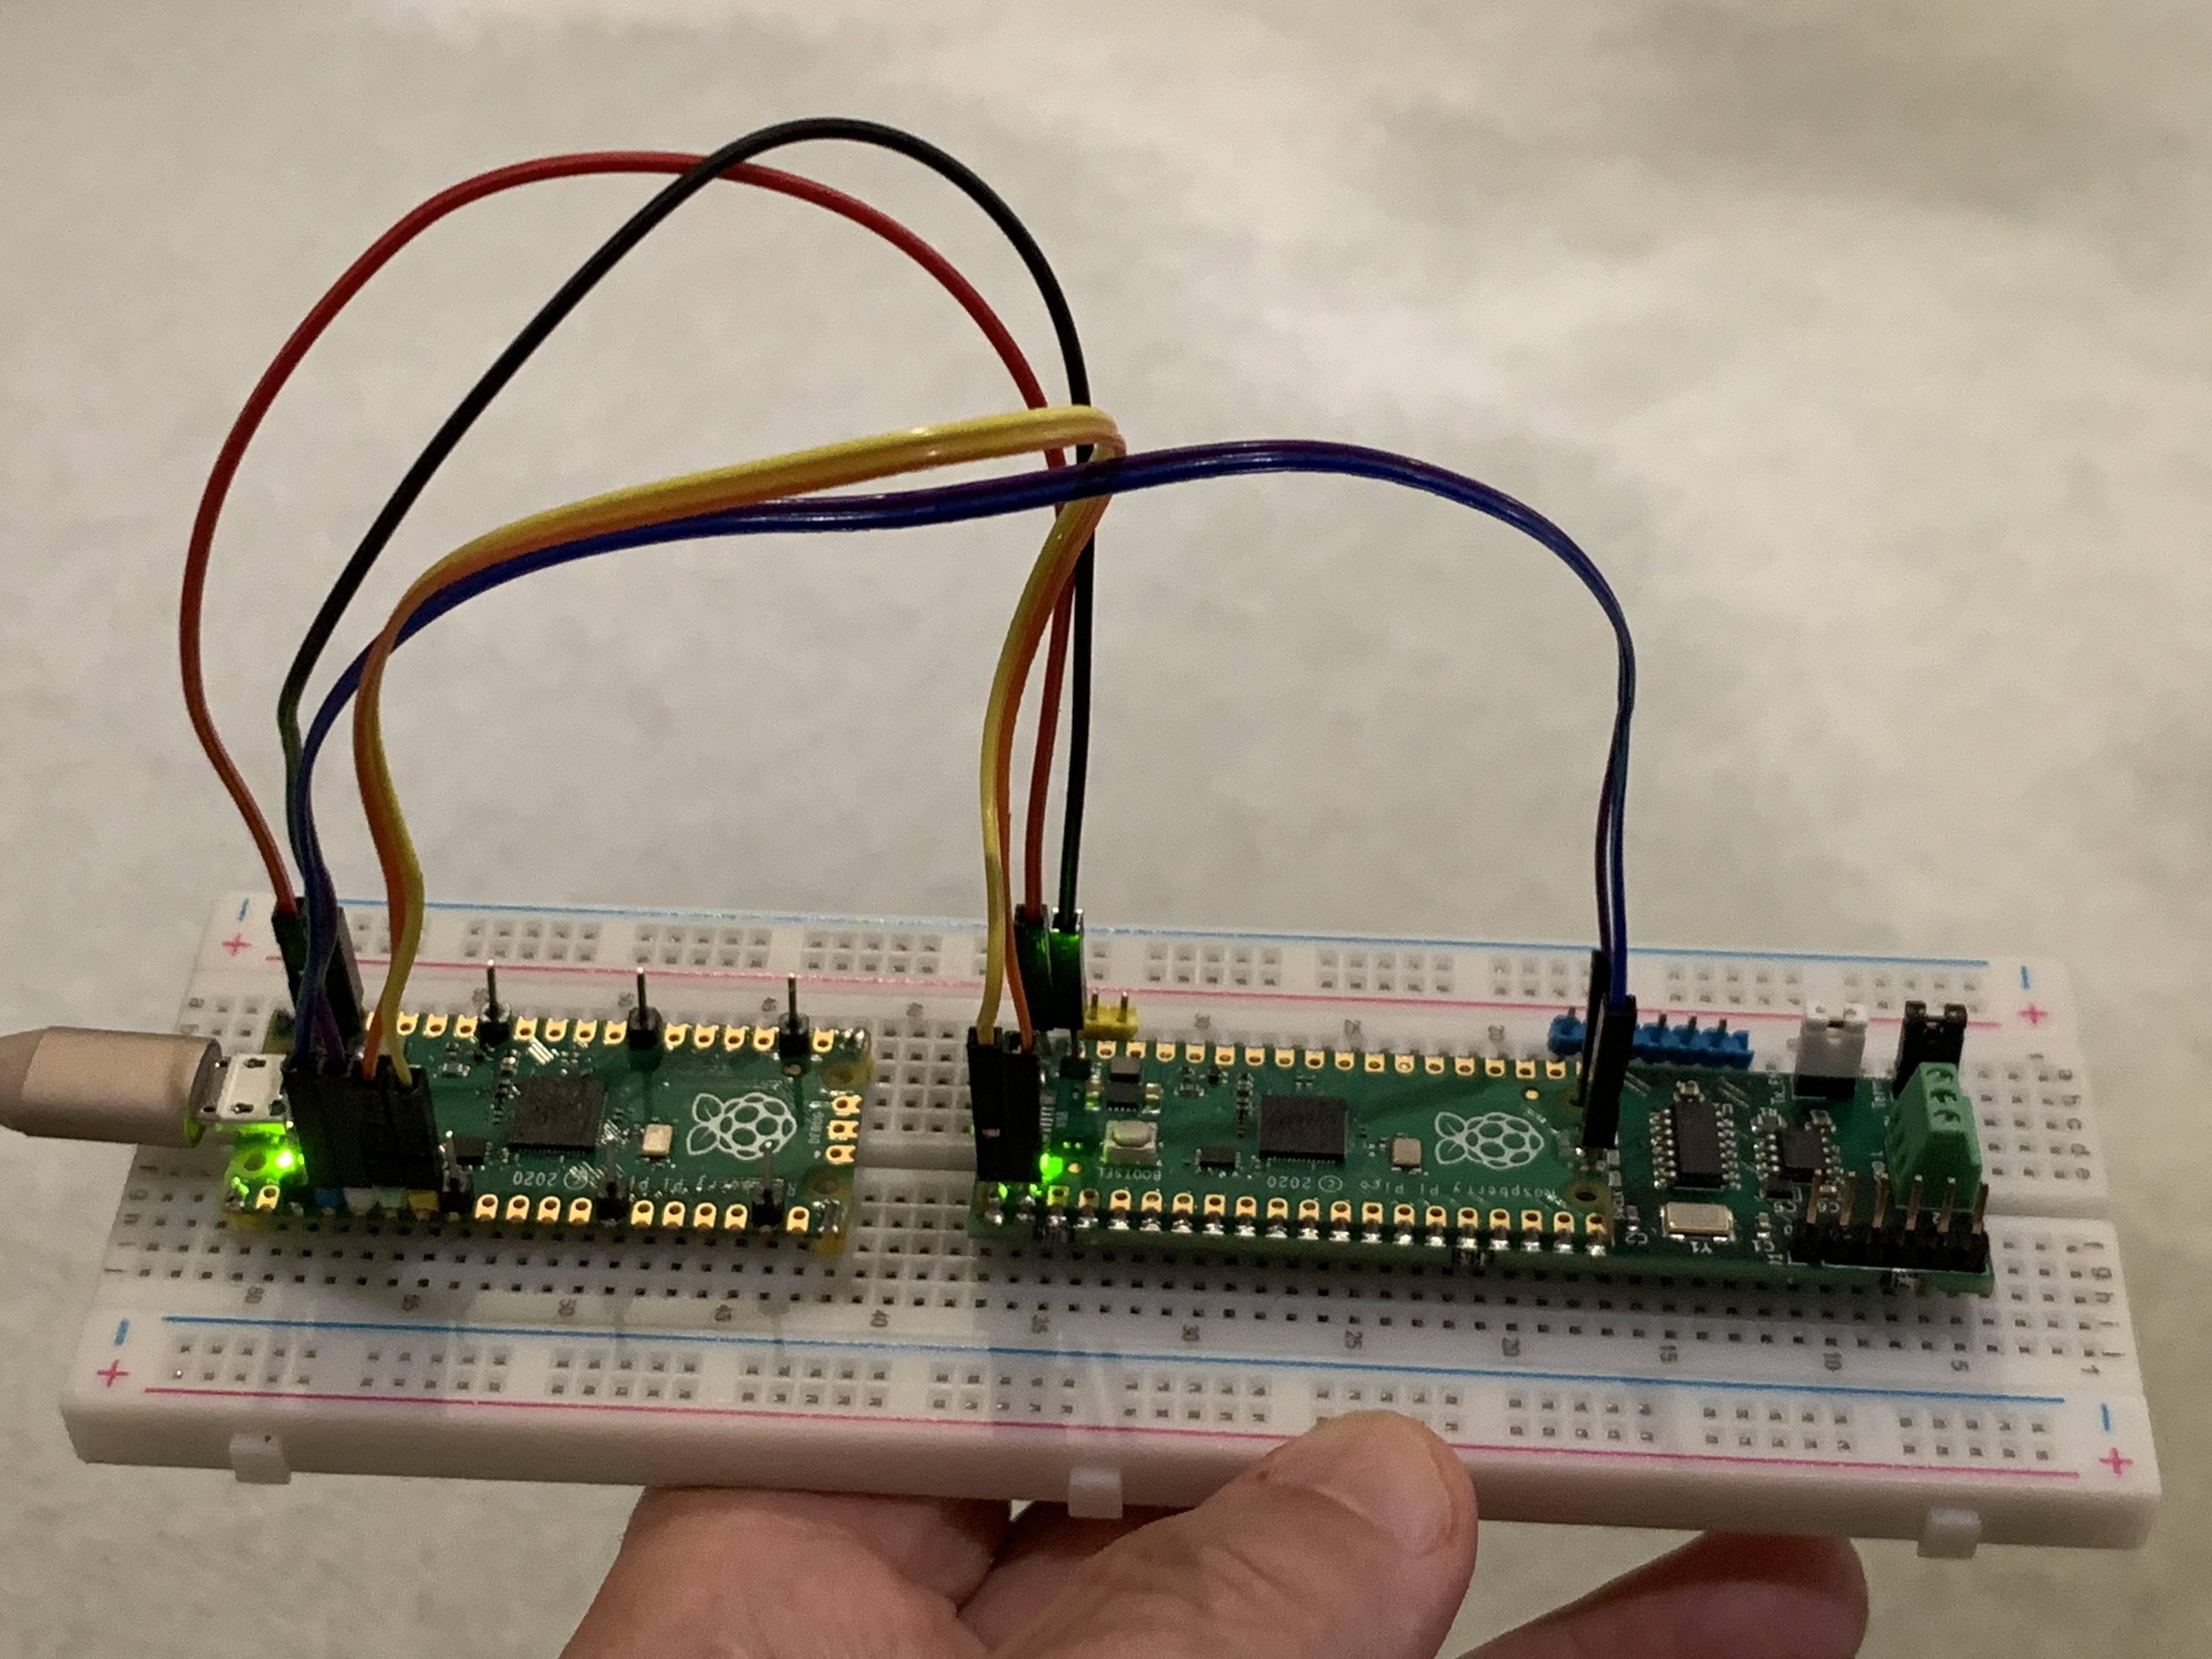
Here I’m running a very simple C test program for the CANPico that just sends a CAN frame every half
second and prints to stdout (it runs at a CAN bit rate of 500kbit/sec).
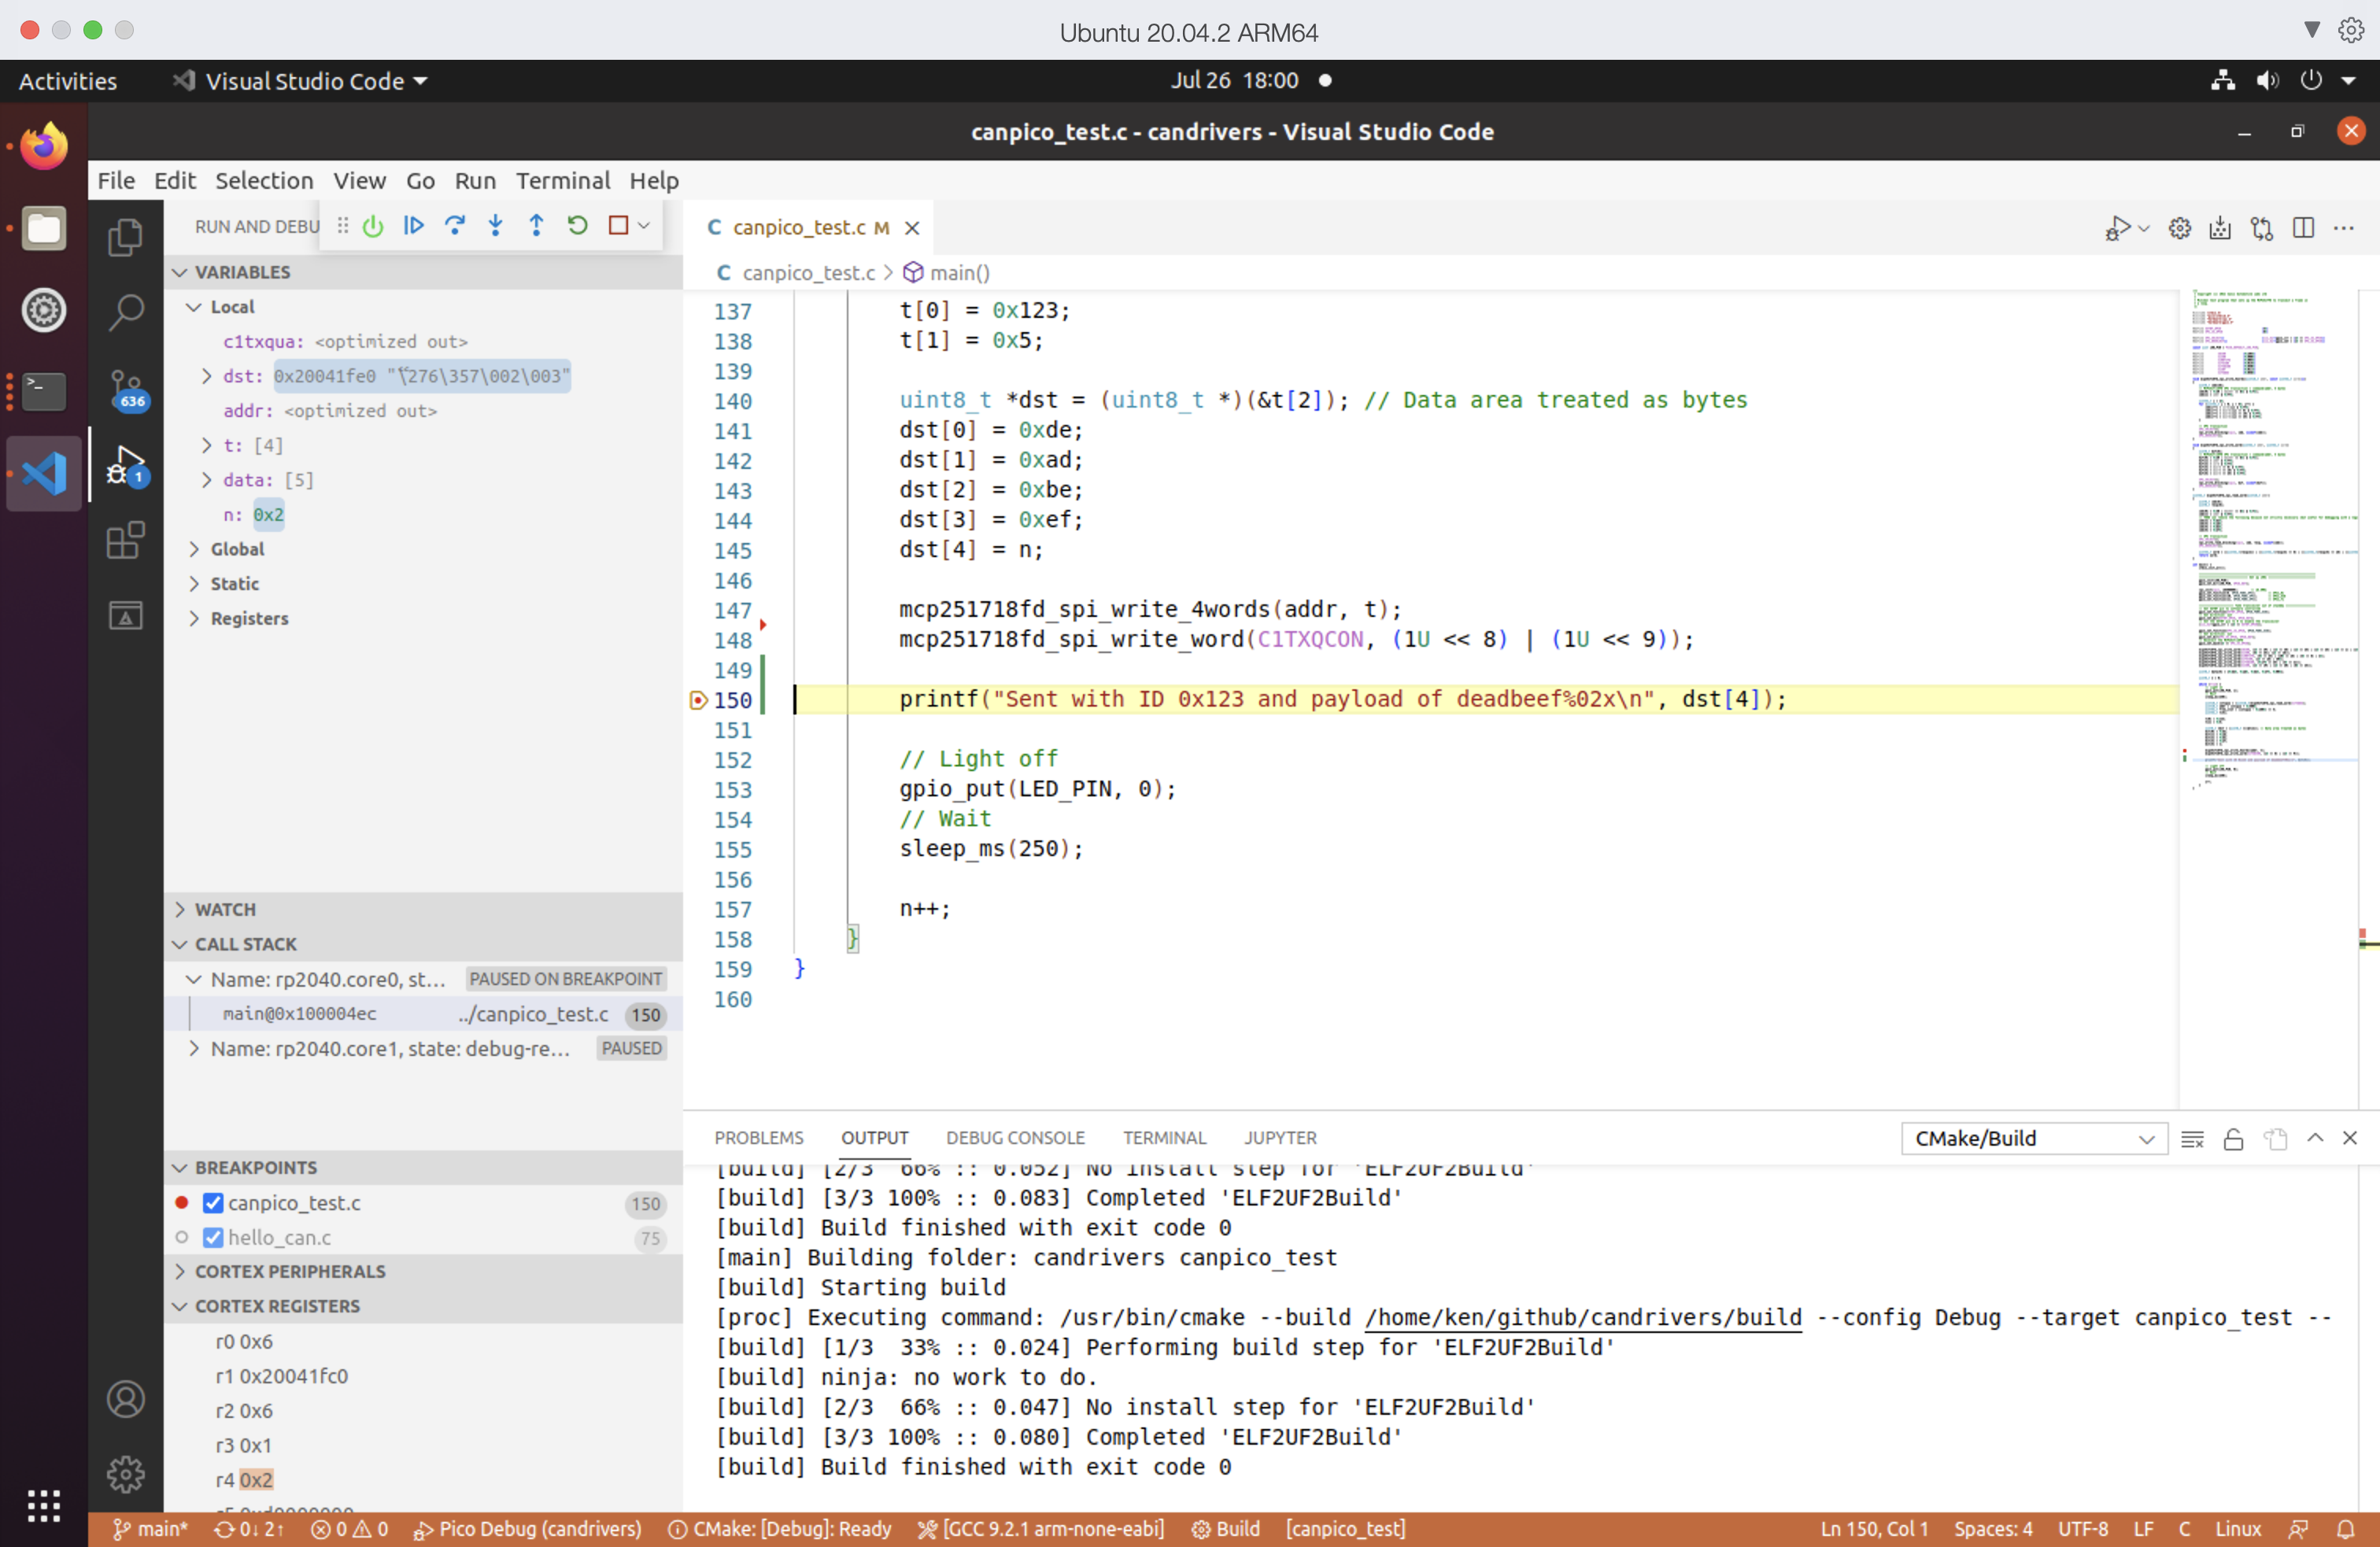
The VSCode debugger looks like this:
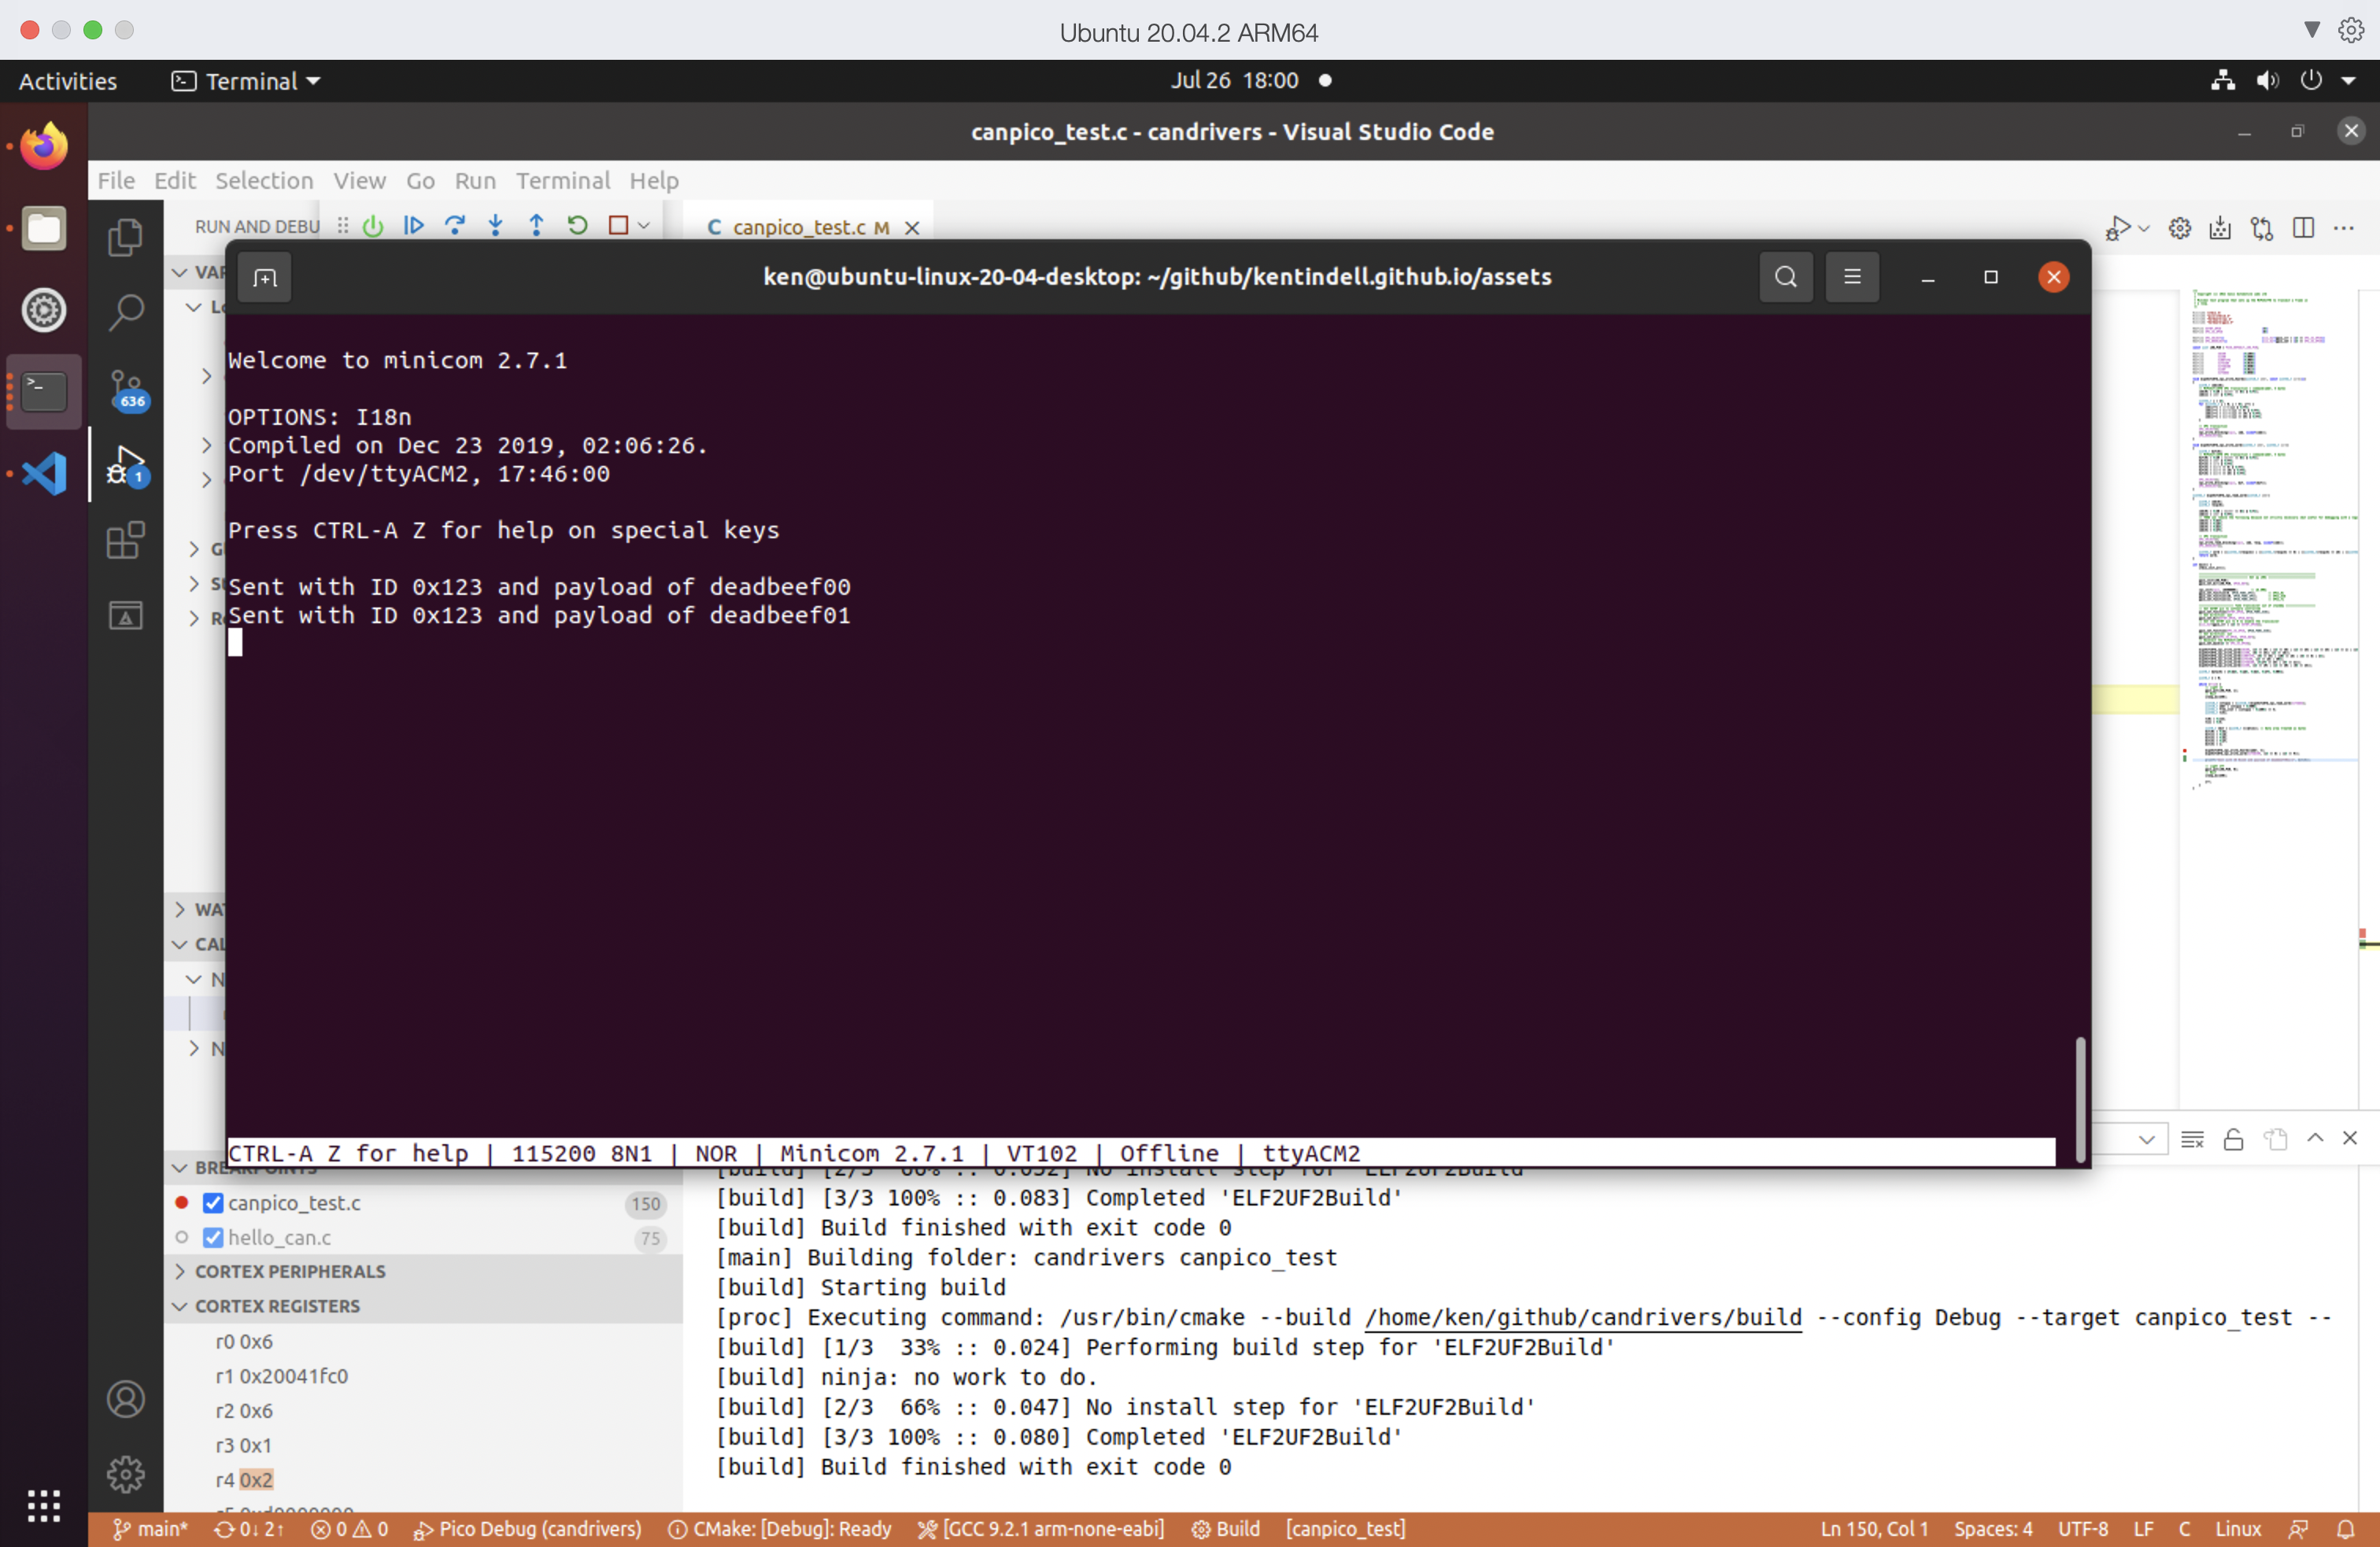
And the minicom terminal window looks like this:
The binary .uf2 firmware for the test program can be flashed into the CANPico to make a neat little development tool for checking CAN is wired up OK.
