
Last year we published a blog post that described the new can2 CAN protocol decoder for many logic analyzers supported by Sigrok we have now updated it to include a new binary output where CAN frames (including error frames) are output in pcapng format. This is a packet capture format that the hugely popular network capture and analysis tool Wireshark uses.
There’s loads of support for Wireshark (including a set of tools from
CSS Electronics that can take CAN DBC files
and display decoded sensor values). And built into Wireshark is a protocol
dissector for CAN frames that that have been captured using a
Linux SocketCAN driver. Normally
these CAN frames would come from a CAN controller interfaced via USB
or SPI (e.g. the popular
SKPang PiCAN2 for the Raspberry Pi). But with the can2 protocol decoder
they can now come from a logic analyzer.
The screenshot below shows Wireshark decoding a sequence of CAN frames:
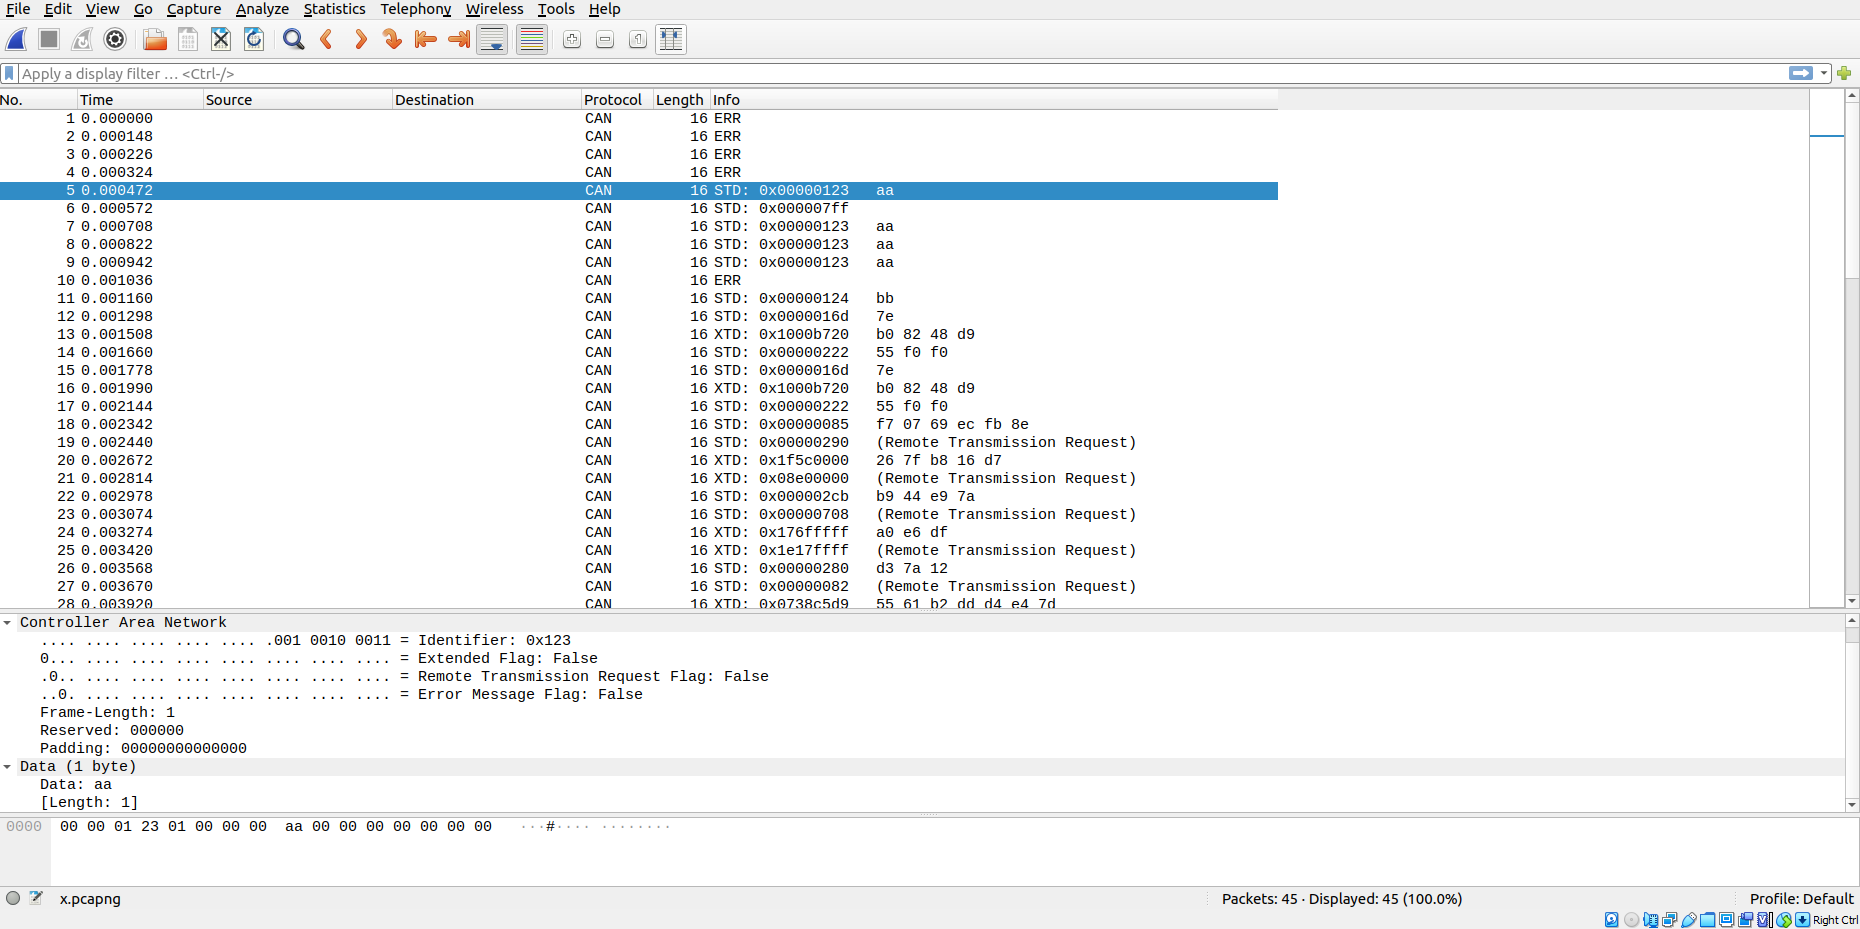
The capture file comes from running sigrok-cli and invoking the
binary output of the can2 decoder called pcapng:
1
$ sigrok-cli -i scratch3.vcd -I vcd:downsample=1000 -P can2:canrx=tcanrx_sync -B can2=pcapng > x.pcapng
The input here is not a live logic analyzer but a VCD file exported from
part of a test harness that includes some CAN bus scenarios. The option
-I vcd:downsample=1000 is used to reduce the sampling down to 1ns
(the VCD export is to 1ps accuracy, which is too much for sigrok-cli to
import without taking ages and spinning up the CPU cooler fans on a laptop).
The output is redirected into x.pcapng. It’s straightforward to create a
named pipe in Linux and use that to make a live connection to Wireshark. For
simplicity we simply used a file. The output of sigrok-cli can also
be piped into tshark, the command-line version of Wireshark.
The PulseView tool shows the timeline of all the CAN frames shown above in the Wireshark trace:
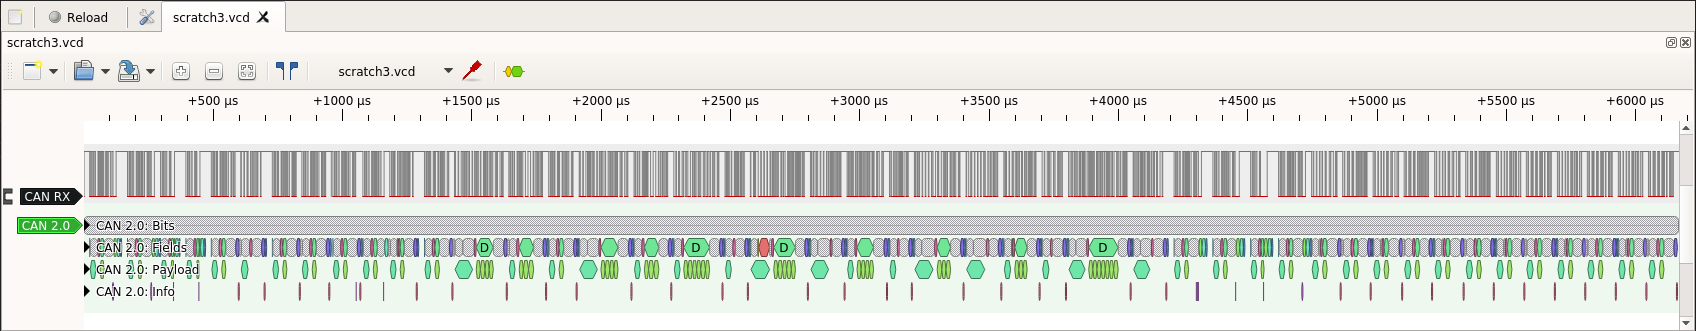
A lot of CAN frames! Zooming in to one of them:
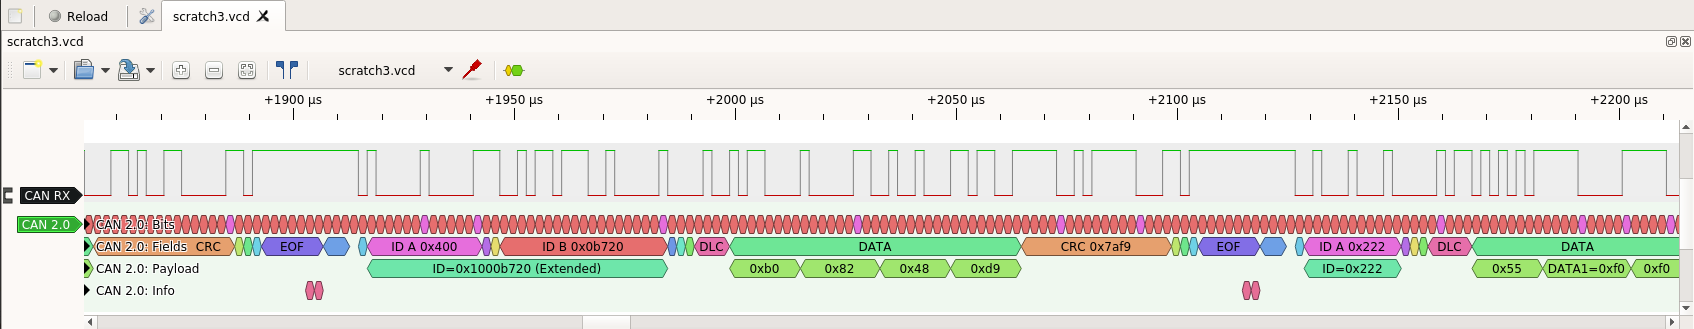
If you look closely, you can see this frame the Wireshark trace. The two tools work nicely together: one shows details of exactly what is happening on the wire, and the other shows a functional trace of the CAN frames on the bus.
The SocketCAN packet format is quite limited for recording CAN protocol
events. It’s OK for recording basic CAN frames, but if there is an error
it doesn’t record the information that was
received up to the error, and it doesn’t know about all the types of error
(e.g. stuff error). It also can’t display the other events that the
can2 decoder already detects (e.g. double receive error).
In the current era where we have to worry about security and attacks at
the CAN protocol level then it needs updating, particularly if these packets
are being logged as part of an intrusion detection system (IDS) for
post-incident analysis. So we are working on a new augmented CAN frame pcapng
packet format that contains much more information about what’s happening on
the CAN bus (along with a new Wireshark dissector to display this information).
